Like some other basket items, official inflation figures aren’t fully reflective of how energy bills impact some consumers, based on when they use energy and how they pay – we’ve crunched some numbers to bring this to life.
The gas and electricity cost indices used by the ONS in the Consumer Price Index (CPI) closely track the headline price cap bill values, as a measure of energy costs in the basket of goods. However, as we have discussed before, the quarterly headline price cap values are not reflective of actual bills through the year.
We’ve made some adjustments to the CPI to account for:
1) The ending of fixed tariffs through 2021/22, capturing around 8m consumers moving from discounted fixed deals to more expensive default tariffs
2) Seasonality in energy consumption to properly reflect costs through the year
3) £400 of Energy Bill Support Scheme Payments, not included in official figures
4) Delays between consumption and payment, meaning most consumers would have paid record energy prices during 2023
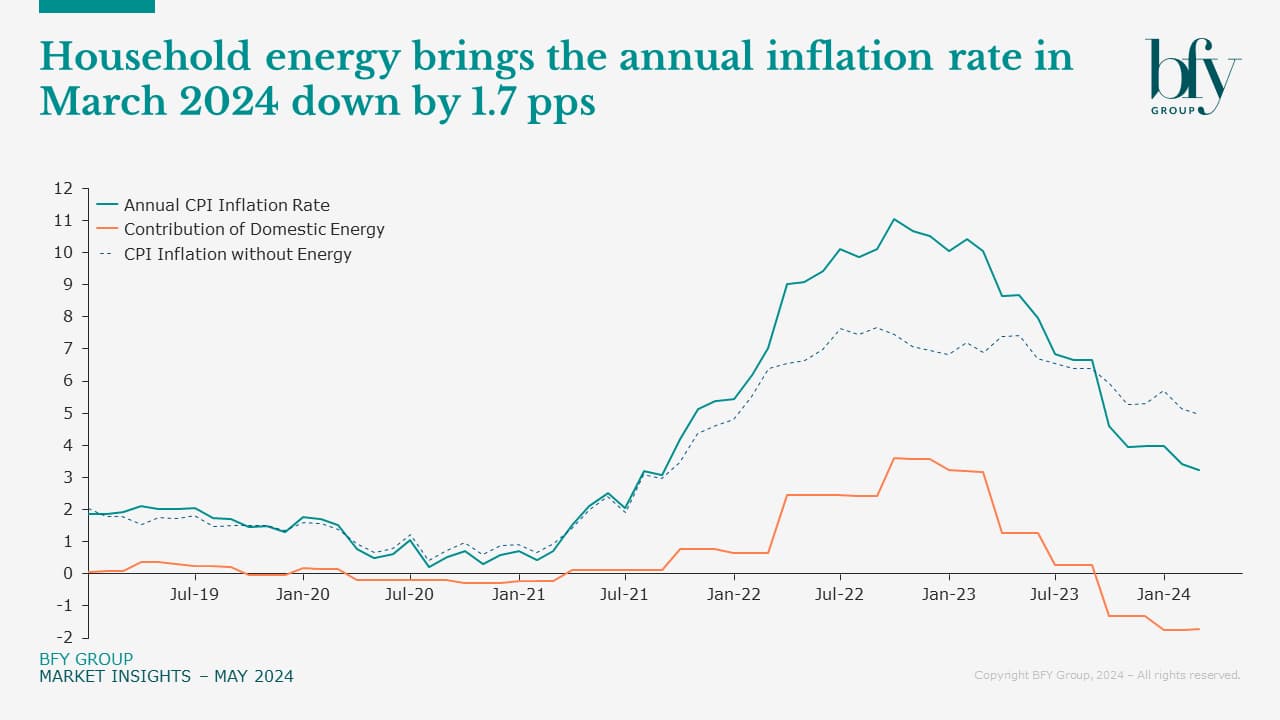
These all mean that, for many consumers, inflation has been higher and longer-lasting than suggested by the CPI. The energy crisis saw official UK inflation reach a peak of 11.1% in October 2022; a third of this directly due to domestic energy costs.
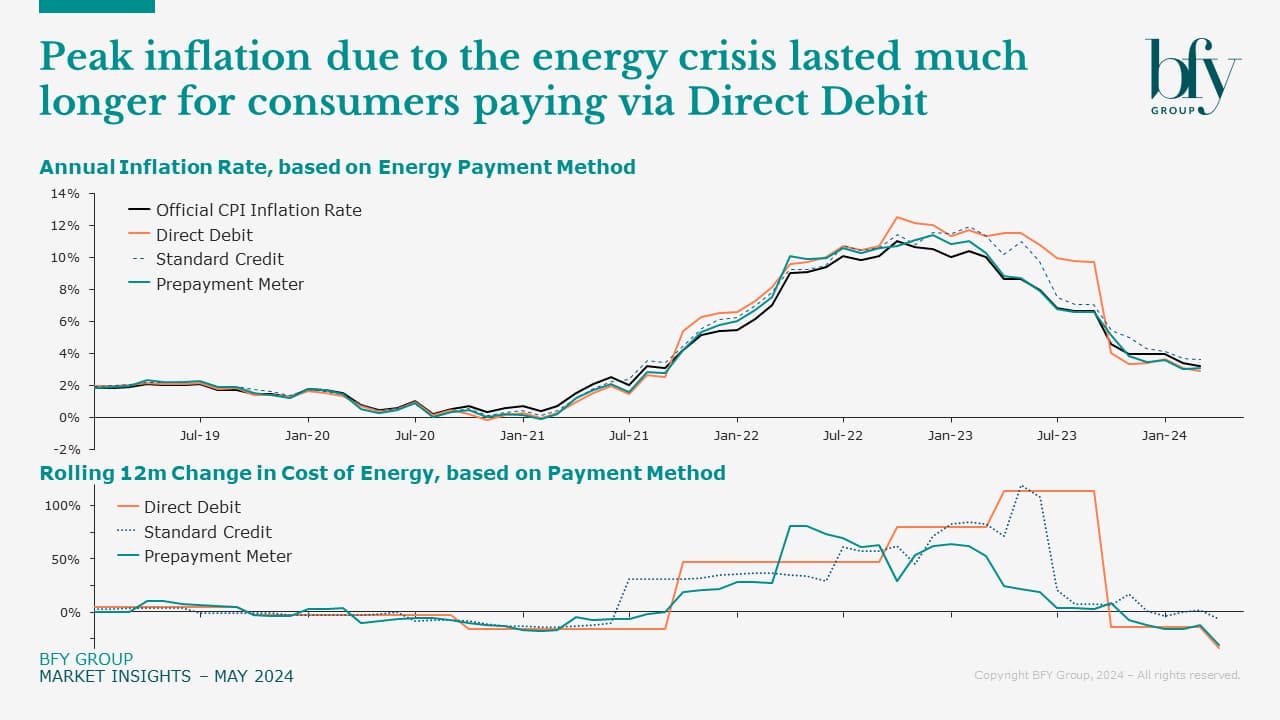
Analysis by Matt Turner and John de Bono shows the real peak was more likely to be 12% in Q1 2023, and payment method impacts the timing of this. When this is factored in, peak inflation lines up closer with the industry debt trends we’ve seen this year.
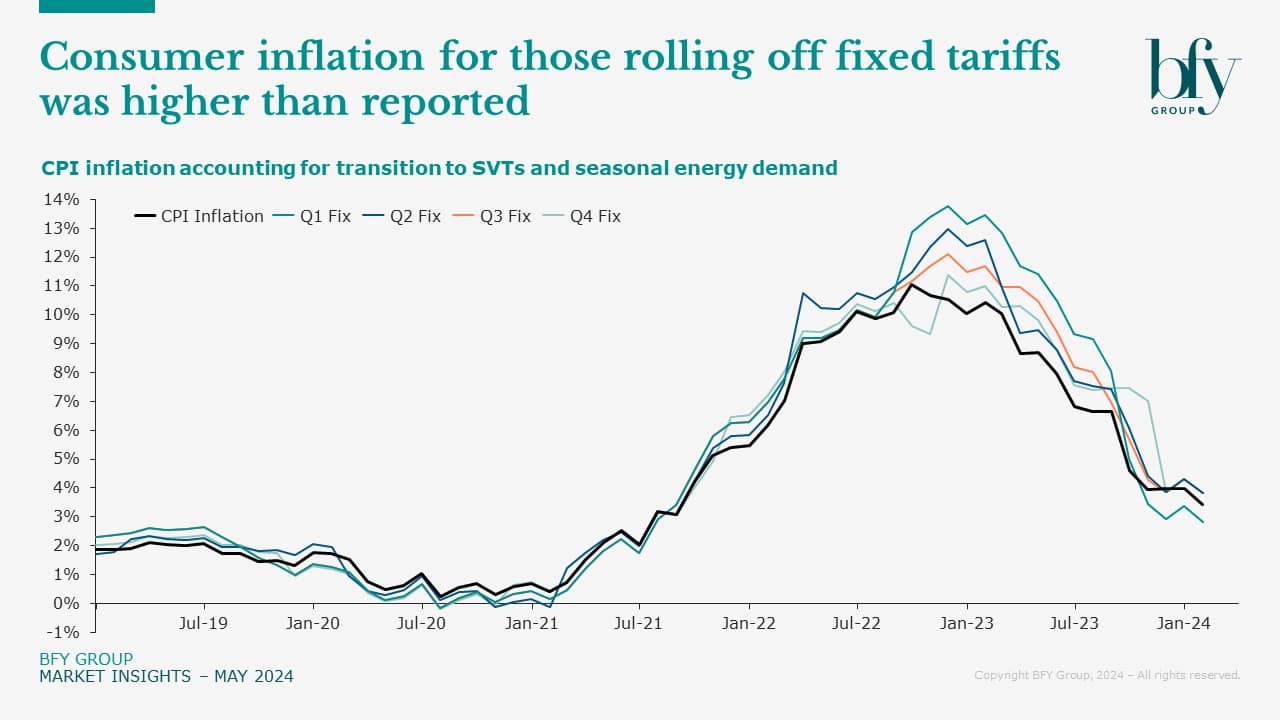
The ONS recognises that consumers experience inflation differently based on their own spending. We show here that some of the most active customer cohorts in the market at the start of the energy crisis, on fixed tariffs saw their personalised CPI peak at 13.8% in Q4 2022. For those paying by Direct Debit, this would have been mitigated to around 12% across Q1 2023.
We also ask how consumers are impacted today, and in the future - as suppliers offer more competitive tariffs, some meaningfully cheaper than the price cap.
Real inflation rates were higher than CPI, due to fixed tariff roll-offs
During the energy crisis, many consumers would have felt an additional (and delayed) price increase due to the ending of fixed tariffs with only the standard variable tariff to switch to.
Between late 2021 and Dec 2022, Ofgem reported an increase in customers on default tariffs from ~60% to 91%, meaning ~8m customers rolled off fixed tariffs and saw increases of up to 96% by rolling onto the default tariff cap.
Taking seasonal demand into account, along with the impact of rolling off fixed tariffs onto default tariffs, our analysis shows the 12-month inflation would have peaked at 13.8% in Dec 2022 for some tariffs expiring in Q1 2022 - having a greater and later impact than the CPI suggests. If it wasn’t for the Energy Bill Support Scheme, the peak inflation rate for these consumers would have been 15%.

Energy payment method impacts the timing of consumer inflation
We’ve taken a simple approach to reflect the impacts of three key payment methods, showing how much influence this had on the timing of peak consumer inflation.
We look at:
- Prepayment (PPM)
- Payment on receipt of bill (POROB)
- Fixed monthly Direct Debit (DD)
For prepayment customers, the cost of energy follows the CPI energy index closely (the price cap) and this cohort of customers feels the change in energy cost faster than any other segment.
For DD and POROB customers, peak inflation was higher due to the removal of fixed tariffs – arriving later due to lags in billing and payment adjustments. We’ve assumed a one month lag to reflect the delayed impacts on POROB customers, but it’s a more complex picture for those on DD, which we’ve covered in the section below.

Consumers on DD likely felt peak inflation in Summer 23, later than CPI suggests
Most suppliers take different approaches to when and how they recalculate and apply changes to customer DD payments. They vary on a wide range of inputs including change tolerances, review cycles, future target balances based on target cashflows, and how to reflect current energy costs against future uncertainty.
All of these are reflected in the differing appetites for changing customers’ DD payments, especially true during the energy crisis, particularly relating to how EBSS was applied to customers. At this time, most suppliers paused DD reviews for at least a short period.
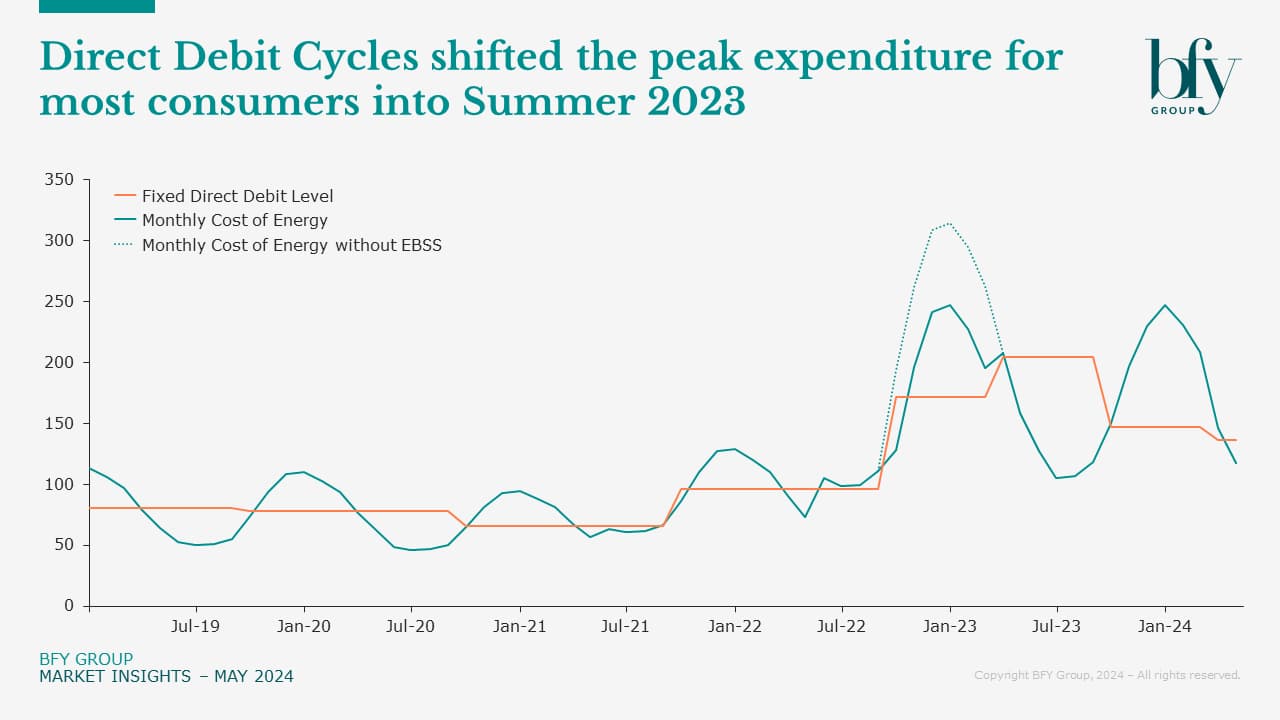
Using a simplistic model of DD cycles, our analysis suggests these customers would have been experiencing peak energy prices across most of 2023, much later than implied by the CPI, with UK inflation officially peaking at 11.1% in October 2022.
If we assume DD levels are reviewed every six months (Apr/Oct), and are set to recover any deficit built up in the delayed update, then consumers on DD would have spent the most on energy during Summer 2023, spreading the impact of seasonal demand and higher costs over a broader period. This also caused an adverse position where consumers on DD would have seen increasing payments, just as headlines talked to falling energy bills and the easing of the energy crisis.

It coincides with trends for industry debt, which has seen rapid growth from Q2 2023 onwards, six months later than the official peak of inflation. This is also partly due to the definition of debt used by Ofgem, meaning arrears aren’t counted until they’re 90 days old, not factoring in rolling balances of DD customers while a DD is live.
Most consumers on DD are only now in 2024 feeling respite from energy prices, yet they’re still paying double what they paid in 2021. This highlights the different experiences faced by consumers using different payment methods, with those on DD and POROB experiencing more inflation, later than those on Pre-Payment.
What’s the impact on consumers now, and in the future?
That was back then, so what about now? When looking at the impact of energy costs on the inflation rate to March 2024 of 3.2%, household energy makes a negative contribution due to falling prices. The CPI rate would be closer to 5%, if not for this fall in energy prices.

As we see the easing cost of energy reflected in the price cap, and therefore customer bills, we’re also seeing tariffs offered that are meaningfully cheaper than the price cap. Consumers can again beat the official rate of inflation by engaging with the energy market. This no longer just means switching supplier – as we’re seeing more suppliers offering retention tariffs, or smart and time of use tariffs (TOU).
Consumers who took advantage of TOU tariffs in recent months will have a far lower personal rate of inflation. TOU tariffs tracked falling wholesale prices much faster, because of how the energy is procured by energy suppliers, meaning some consumers will have beaten the energy price cap by up to 30%.
Now the wholesale energy market has flattened, TOU tariffs aren’t necessarily a one-size-fits all. However, they can still significantly favour customers who can shift their usage away from peaks – with some also getting an added benefit from the Demand Flexibility Service.
Overall, engaged energy customers are benefitting from the market, but engagement looks different. Falling inflation for particular cohorts of customers suggests easing pressures on disposable income, and a brighter short-term outlook for market participants with growth plans built around energy services and solutions.
We continue to see that one size doesn’t fit all, and clear, consistent segmentation of customers is key.
Get our full Inflation Analysis pack
If you want to see our Inflation Analysis in full detail, click here to get our downloadable insight pack. Share it with your team if they'd find it useful.
If you'd like to know more about the impact on your customers, and how you support them as more tariffs become available, contact Tom Bromwich.
Tom Bromwich
Director
Tom leads client engagements with a particular focus on commercial strategy, pricing, customer acquisition and retention.
View Profile

